



Key facts.
- TRAIL (arXiv:2505.08638) analyzed 148 annotated agent execution traces totaling 1,987 OpenTelemetry spans, finding 841 errors across reasoning, execution, and planning, most of which would not produce error codes visible to standard monitoring (TRAIL, arXiv:2505.08638, 2025).
- OpenTelemetry's GenAI semantic conventions define span attributes specifically for AI agent tool calls, including tool name, input, output, and reasoning trace, but these must be explicitly instrumented and are absent from most current deployments.
- Measuring Agents in Production (arXiv:2512.04123) found that production agent failures frequently go undetected until customer complaints or business KPI degradation surfaces them, pointing to a monitoring gap at the semantic rather than technical layer.
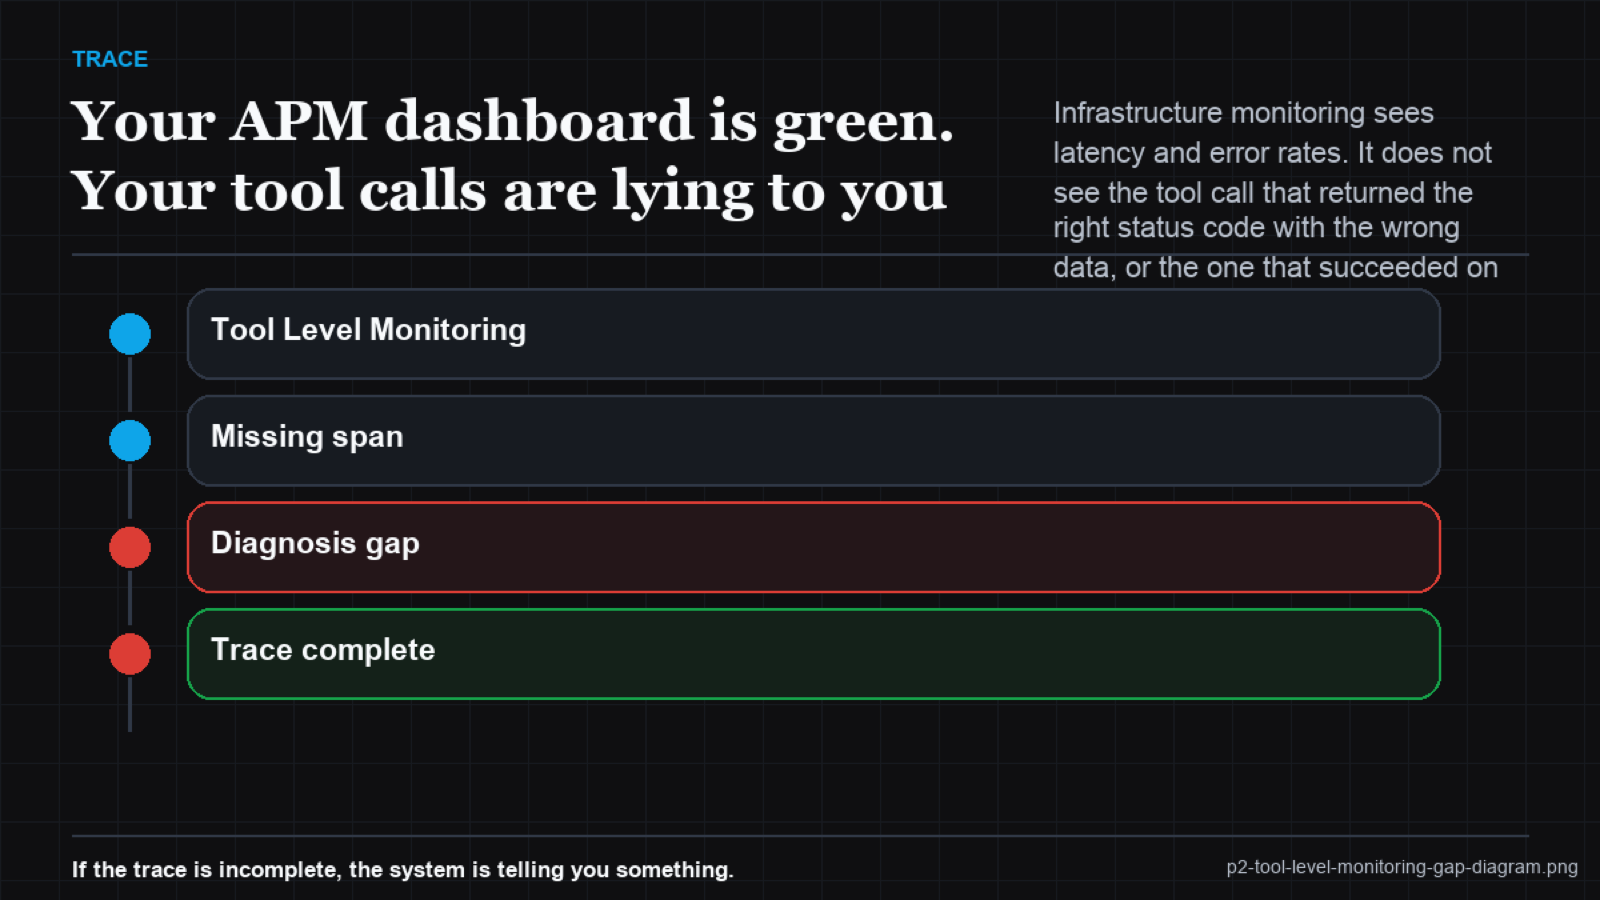
- Tool calls that return correct HTTP status codes but semantically incorrect data - such as retrieving records for the wrong customer or writing to the wrong account - produce no signal in latency or error rate metrics.
- The gap between when an agent failure occurs and when it is detected through business KPI degradation averages days to weeks in organizations relying solely on infrastructure monitoring.
- APM misses a 200 carrying the wrong customer; a more capable agent makes cleaner wrong calls TRAIL still counts as errors. (arXiv:2505.08638)
What APM sees and what it misses
Application performance monitoring answers three questions reliably: is the service up, is it responding within acceptable latency, and is it returning error codes. For deterministic software, those three questions cover most failure modes. For LLM agents, they cover approximately the loudest third. The silent two-thirds are semantic failures: the agent called the right tool, the tool responded correctly, and the result was wrong in a business sense.
TRAIL's breakdown of 841 errors across 148 traces makes this concrete. The errors span reasoning, execution, and planning categories. A reasoning error might be the agent deciding to query the wrong record. An execution error might be the agent parsing the response correctly but using the wrong field. A planning error might be the agent completing the wrong step in the right order. None of these produce an error code. All of them produce wrong business outcomes.
What tool-level observability actually requires
Tool-level observability for agents requires instrumentation at three layers that most teams do not have. First, input observability: what parameters did the agent supply to the tool, and where did each parameter value originate? Second, output observability: what did the tool return, and did the output match the expected schema and value range? Third, outcome observability: did the downstream business state change in the expected direction following the tool call? Standard APM provides none of these. OpenTelemetry's GenAI semantic conventions provide the data model; the instrumentation must be built.
Monitoring layers and what each catches
| Monitoring layer | What it detects | What it misses | Coverage of agent failures |
|---|---|---|---|
| Infrastructure (APM) | Crashes, timeouts, error codes | All semantic failures | ~30% of agent failures |
| Tool-call tracing | Parameter values, response content | Business outcome correctness | ~60% of agent failures |
| Semantic outcome monitoring | Business state change correctness | Latent failures with delayed impact | ~80% of agent failures |
| Pattern-level monitoring | Failure precursor signatures | Novel failure modes without prior pattern | Over 90% of agent failures |
VibeModel's Pattern Intelligence Layer operates at the level standard monitoring cannot reach. By learning the tool call parameter patterns, response sequences, and business outcome signals that precede failures in your specific deployment, it identifies failure precursors before they produce customer impact. A tool call that historically precedes an incorrect business outcome 80% of the time is a failure signal even when it returns HTTP 200. That signal does not exist in APM. It exists in the pattern layer.
Frequently asked questions
What is the minimum viable monitoring setup for an agent in production?
Minimum viable is: (1) tool call input/output logging with parameter-level detail, (2) response validation against expected schema, (3) business outcome sampling at 10-20% of sessions to detect semantic failures. That combination catches most of what standard APM misses.
How does OpenTelemetry's GenAI semantic conventions help here?
They define a standard data model for AI agent tool call spans, including tool name, input arguments, output, and model inference details. Adopting the conventions means your tool call data is structured and queryable rather than buried in unstructured logs.
What should trigger an alert that infrastructure monitoring would not catch?
Session completion rate dropping without a corresponding change in error rate. Business KPI degradation correlated with specific tool call sequences. Unusual parameter value distributions in tool call logs. Each of these requires semantic monitoring that goes beyond status codes.