


Every step can return 200 while the final answer is built on 60% of the data. In a documented multi-agent trace, a handoff silently truncated 15 data points to 9; the analysis ran on partial data, every agent reported success, and nobody knew (Detecting Silent Failures in Multi-Agentic AI Trajectories, arXiv:2511.04032, 2025). A green dashboard is not a correct outcome.
Key facts.
- Silent failures produce no error code: in a documented multi-agent trace, a handoff truncated 15 data points to 9, every step returned success, and the final report ran on partial data (Detecting Silent Failures in Multi-Agentic AI Trajectories, arXiv:2511.04032, 2025).
- Reliability needs evaluation as a continuous runtime function, because a one-time pre-launch check cannot catch behavior that degrades silently in production (Evaluation-Driven Development and Operations of LLM Agents, arXiv:2411.13768, 2025).
- These failures, goal drift, context loss, quality degradation, do not show up in error-log monitoring and require outcome and quality checks to detect (arXiv:2511.04032, 2025).
- An upgrade lifts the score, not the blind 200; resolution rate drifts down days later, and that delay is the cost. (arXiv:2511.04032)
Why does the dashboard stay green?
Because traditional monitoring measures the plumbing, not the outcome. A tool call that returns 200 and throws no exception is recorded as a success, latency and error-rate panels stay nominal, and the run logs task complete. None of that knows whether the agent sent the right filter, read the result correctly, or made the right decision. This is silent success: the trajectory finishes cleanly while the outcome is wrong. Documented multi-agent traces show how common it is: a handoff silently drops data, every step returns success, and the final output is wrong while the dashboard stays green. The metrics are green because they were never measuring the thing that failed.
Why do business KPIs catch it first?
Because the KPI is the only place the wrong outcome actually shows up. The agent confidently used a wrong but valid parameter, so no 5xx fired and no exception was thrown, and the mistake only becomes visible when its accumulated effect reaches a downstream number: a resolution rate that slips, refunds that rise, a cohort that quietly churns. By then it has been wrong for days across many runs, and you are reconstructing what happened from logs that recorded success. The lag is the whole problem: infrastructure alerts in seconds on a crash, but a semantically wrong agent produces no crash, so the first alarm is a business review weeks later.
How do you see tool-level failures in time?
Monitor outcomes, not just status. Trace the full trajectory, the prompt, the exact tool calls and arguments, the results, and the decisions, using standardized spans so each tool execution is inspectable rather than inferred. Add semantic checks on top: validate tool outputs and final results against ground truth, business invariants, or an independent judge, and alert on semantic drift and low-confidence runs, not only on errors. Tie agent runs to the business metric they should move and watch them together. Sample high-stakes runs for human review, and run continuous online evaluation so degradation surfaces as a check failing rather than a quarter missing (arXiv:2411.13768). The green light then means the outcome was right, not merely that nothing crashed.
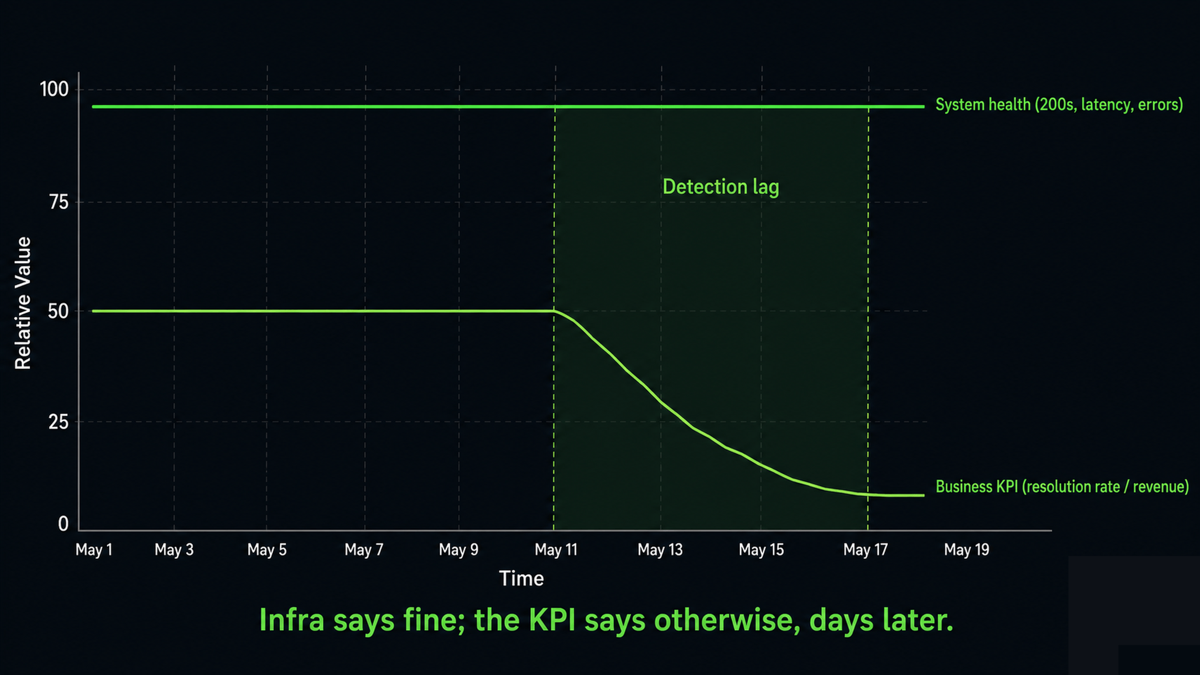
What each layer sees
| Signal | Infra monitoring | Outcome monitoring |
|---|---|---|
| Tool returned 200, wrong args | Success | Caught by output validation |
| Result misread by agent | Invisible | Caught by ground-truth check |
| Wrong but valid decision | Green | Flagged by business-invariant check |
| Slow semantic drift | KPI weeks later | Alerted on semantic-drift monitor |
| Low-confidence run | Not tracked | Sampled for human review |
The pattern is that infrastructure monitoring certifies that nothing crashed, which is not the same as the agent doing the right thing, so silent failures hide behind green panels until a KPI exposes them. Trace the trajectory, check outcomes against ground truth and business rules, and evaluate continuously, and the failure surfaces in minutes instead of a quarter. Watching the outcome rather than the status code, so success means correct and not merely uncrashed, is reliability at the pattern level, which is what VibeModel builds as the Pattern Intelligence Layer.
Frequently asked questions
Why isn't a 200-and-no-errors enough?
Because it only says the call completed, not that the agent did the right thing. A wrong-but-valid parameter returns 200, so success has to be judged on the outcome, the final state, not the status code.
What is the cheapest outcome check to add?
An output validator on high-stakes tools that compares the result against a business invariant or ground truth. It converts a silent wrong result into an alert at the moment it happens.
How do I shorten the detection lag?
Trace full trajectories, add semantic and confidence monitors that alert independently of error rate, and tie runs to the KPI they should move so drift is visible immediately instead of at quarter-end.