



Key facts.
- Traditional monitoring confirms a request succeeded but cannot classify whether the agent's reasoning was sound or which tool it should have picked. source
- What teams actually need to see is the reasoning trace, the tools considered, the tool invoked, the arguments, and the response, stitched per decision. source
- AI observability has to track whether the agent understood the query, whether retrieved context was relevant, and whether the output was accurate and policy-aligned. source
- OpenTelemetry's GenAI conventions define the span structure that makes per-decision reasoning views portable across backends. source
Why isn't a success rate enough?
A pass/fail tile suits loud failures; agents return confident wrong ones, no upgrade removes the need, and a model right on tools 94% hits 38% of goals, a retry's true gap. (source)
Because a success rate is an aggregate, and you fix agents one decision at a time. When the rate dips, the tile tells you something is wrong and nothing about what. You still have to open the run, find the decision that went sideways, and understand why the agent chose it. If the dashboard does not carry the reasoning, you are reconstructing the decision from logs, which for a non-deterministic system you often cannot reproduce. The "why" has to be captured at the moment of the decision or it is gone.
A pass/fail view also hides the most dangerous case entirely: the confident wrong answer that counts as a success because the call returned. The dashboard shows green while the decision was bad. Only a reasoning view exposes that.
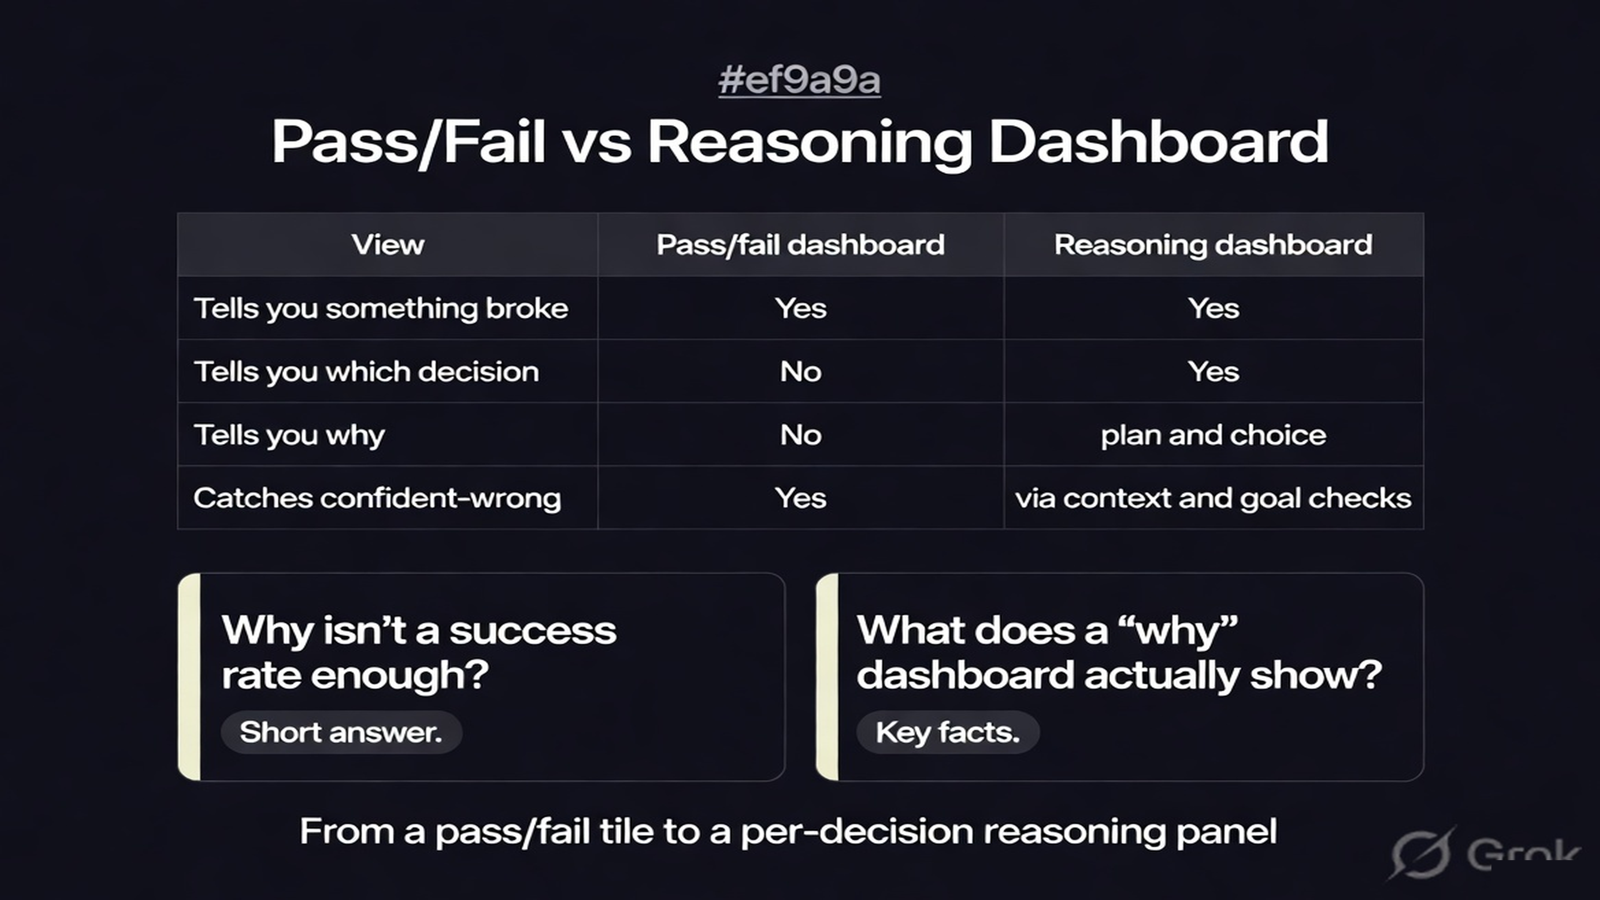
What does a "why" dashboard actually show?
Per decision, it shows the plan the agent formed, the tools it considered, the tool it picked and the arguments it passed, the response that came back, and the input that drove the choice. Around that, it shows whether the retrieved context was relevant and whether the final output satisfied the goal. The success rate stays, but it becomes a way in: click the dip, land on the decisions that caused it, read the reasoning, fix the cause.
| View | Pass/fail dashboard | Reasoning dashboard |
|---|---|---|
| Tells you something broke | Yes | Yes |
| Tells you which decision | No | Yes |
| Tells you why | No | Yes, plan and choice |
| Catches confident-wrong | No | Yes, via context and goal checks |
A Pattern Intelligence Layer is what makes the "why" a standing feature of the dashboard, not a forensic exercise. Reliability at the pattern level means each decision's plan, candidates, choice, and driving input are captured and surfaced as the agent runs, so root cause is a click from the metric instead of an archaeology project. Keep the success rate. Make it the entry point to the reasoning, not the whole story.
Frequently asked questions
Isn't a success rate the most important metric?
It is a good entry point and a poor endpoint. It flags that something is wrong but never why. Pair it with per-decision reasoning so the dip leads somewhere.
What is the minimum "why" to capture?
The plan, the candidate tools, the chosen tool and arguments, and the input that drove the choice. With those four you can usually reconstruct the decision.
Why capture it live instead of from logs?
Non-determinism. You often cannot reproduce the decision later, so the reasoning has to be recorded at the moment it happens.