


Agent failures are often impossible to even reproduce. Because the same input can produce a different run, agentic systems fail in ways you cannot replay, so without structured traces you debug by guessing (Beyond Black-Box Benchmarking: Observability of Agentic Systems, arXiv:2503.06745, 2025). When your production agent calls the wrong tool, the explanation is in a trace you either captured or lost.

Key facts.
- OpenTelemetry's GenAI semantic conventions define an execute_tool span with standardized attributes including gen_ai.tool.name, gen_ai.tool.call.arguments, and gen_ai.tool.call.result, plus operation and model attributes, giving tool invocations one interoperable shape (OpenTelemetry GenAI agent and framework spans, 2025).
- Span naming follows an operation-then-name pattern, for example execute_tool web_search, so GenAI-aware backends recognize and group tool calls automatically (OpenTelemetry GenAI spans, 2025).
- Observability vendors now consume these conventions natively, so standardized GenAI spans flow into existing tracing without proprietary instrumentation (Datadog LLM Observability, native OTel GenAI support, 2025).
Why is a wrong tool call so hard to debug?
Without execute_tool spans, a wrong tool choice hides in logs; a more capable model leaves the same blind trace. (arXiv:2503.06745)
Because by default the decision leaves no structured trace. The model read a catalog of tool descriptions, chose one, and wrote arguments, and all you have afterward is a log line or a framework-specific blob. You cannot easily ask which tools were even in context, why a similar-sounding one was passed over, what arguments actually went out, or what the tool returned before the agent moved on. So you reproduce by hand and guess. The information existed at the moment of the call. The problem is that nothing captured it in a form you can query, which is the difference between an incident you close in minutes and one you stare at for an afternoon.
What do standardized tool spans give you?
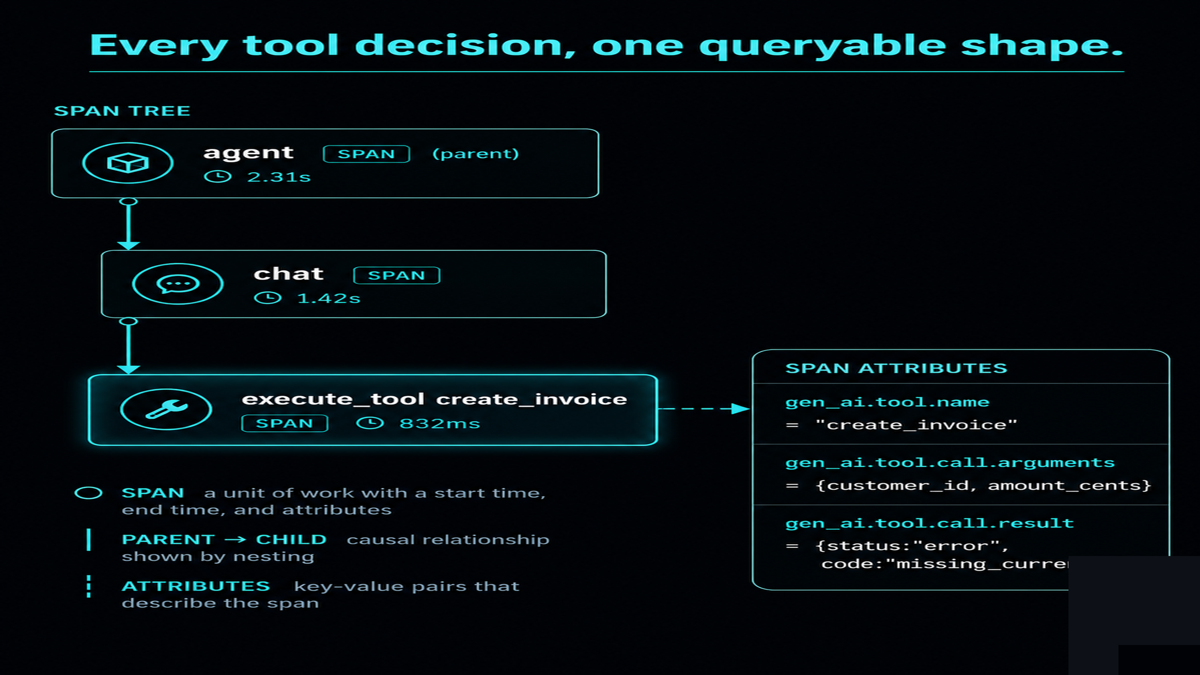
A common shape for every tool decision. OpenTelemetry's GenAI conventions wrap each tool execution in an execute_tool span and attach named attributes: the tool name, the arguments sent, the result returned, the operation, the model (OpenTelemetry). Because the span is named execute_tool followed by the tool name, backends can group and chart tool calls without custom parsing (OpenTelemetry). The planning and reasoning spans are the parents, so you can walk from the agent decided X to it called tool Y with these arguments and got this back. That turns the three questions you always ask during a tool incident, which tool, what arguments, what response, into attributes you filter and aggregate across thousands of runs.
# One execute_tool span, standardized attributes
span: execute_tool create_invoice
 gen_ai.tool.name = "create_invoice"
 gen_ai.tool.call.arguments = { "customer_id":"cus_123", "amount_cents":4900 }
 gen_ai.tool.call.result = { "status":"error", "code":"missing_currency" }
 gen_ai.operation.name = "execute_tool"
# "every call that returned missing_currency" is now a query, not a grep.
How do you instrument tool calling without a rewrite?
Emit GenAI-convention spans from the layer that already runs your tools. Wrap each tool execution in an execute_tool span, set the tool name, sanitized arguments, and result, and let it nest under the agent and chat spans so the causal chain is intact. Because the conventions are standard, the spans flow into observability backends that support them natively, so you get tool-level traces inside the same system you already use for application performance (Datadog). Sanitize sensitive arguments at the span boundary, add a custom attribute for tool-selection rationale where your framework exposes it, and keep results attached so a failure shows what the tool actually returned. The payoff is that the next wrong tool call is something you query and explain, not something you reconstruct.
The same incident, two ways
| Question during an incident | Unstructured logs | execute_tool spans |
|---|---|---|
| Which tool ran? | Grep and hope | gen_ai.tool.name attribute |
| What arguments went out? | Often not logged | gen_ai.tool.call.arguments |
| What did the tool return? | Scattered | gen_ai.tool.call.result |
| Why this tool over a similar one? | Unknowable | Parent reasoning span + rationale attribute |
| Trend across runs | Manual | Filter and aggregate spans |
The pattern is that a tool decision you did not trace is a tool decision you cannot explain, and at production scale that gap is where wrong-tool incidents go to hide. Standardized execute_tool spans capture which tool, what arguments, and what result, under one shape every backend understands, so diagnosing a tool failure is a query rather than an excavation. Building that trace of every tool decision into the loop, so the boundary explains itself, is what VibeModel builds as the Pattern Intelligence Layer.
Frequently asked questions
Do I need a new observability vendor?
No. The GenAI conventions are standard, and major backends consume them natively, so the spans land in the tracing system you already run alongside your application traces.
Won't logging arguments leak sensitive data?
Sanitize at the span boundary: redact or hash sensitive fields before they are attached. You keep the shape of the call for debugging without storing the secret values.
What single attribute helps most?
The result. Capturing gen_ai.tool.call.result is what lets you find every call that failed the same way and explain a wrong-tool incident in one query.