



Key facts.
- The Grafana Labs Observability Survey 2025 reports observability spend averaging about 17% of total compute infrastructure spend (with a lower median), based on more than 1,200 respondents. These are self-reported figures.source
- Complexity and overhead, not raw cost, is the most frequently cited observability obstacle, and a large majority of users report struggling with both.source
- AI and agent workloads inflate telemetry sharply: a single RAG pipeline (vector lookup, retrieval, LLM call, post-processing) is reported to generate on the order of 10x to 50x the telemetry of an equivalent traditional API call (a reported vendor figure, not an independent benchmark).source
- The standard lever is a telemetry pipeline (for example Cribl Stream) that filters, enriches, routes, and reduces data before long-term storage, keeping volume and egress under control without losing tool choice.source
- Capture-everything scales the bill not the insight, and a frontier model doesn't spare you, since MAKER proves even 99% per-step reliability derails, so thin budgets blind. (source)
Why do agent workloads blow up the telemetry bill?
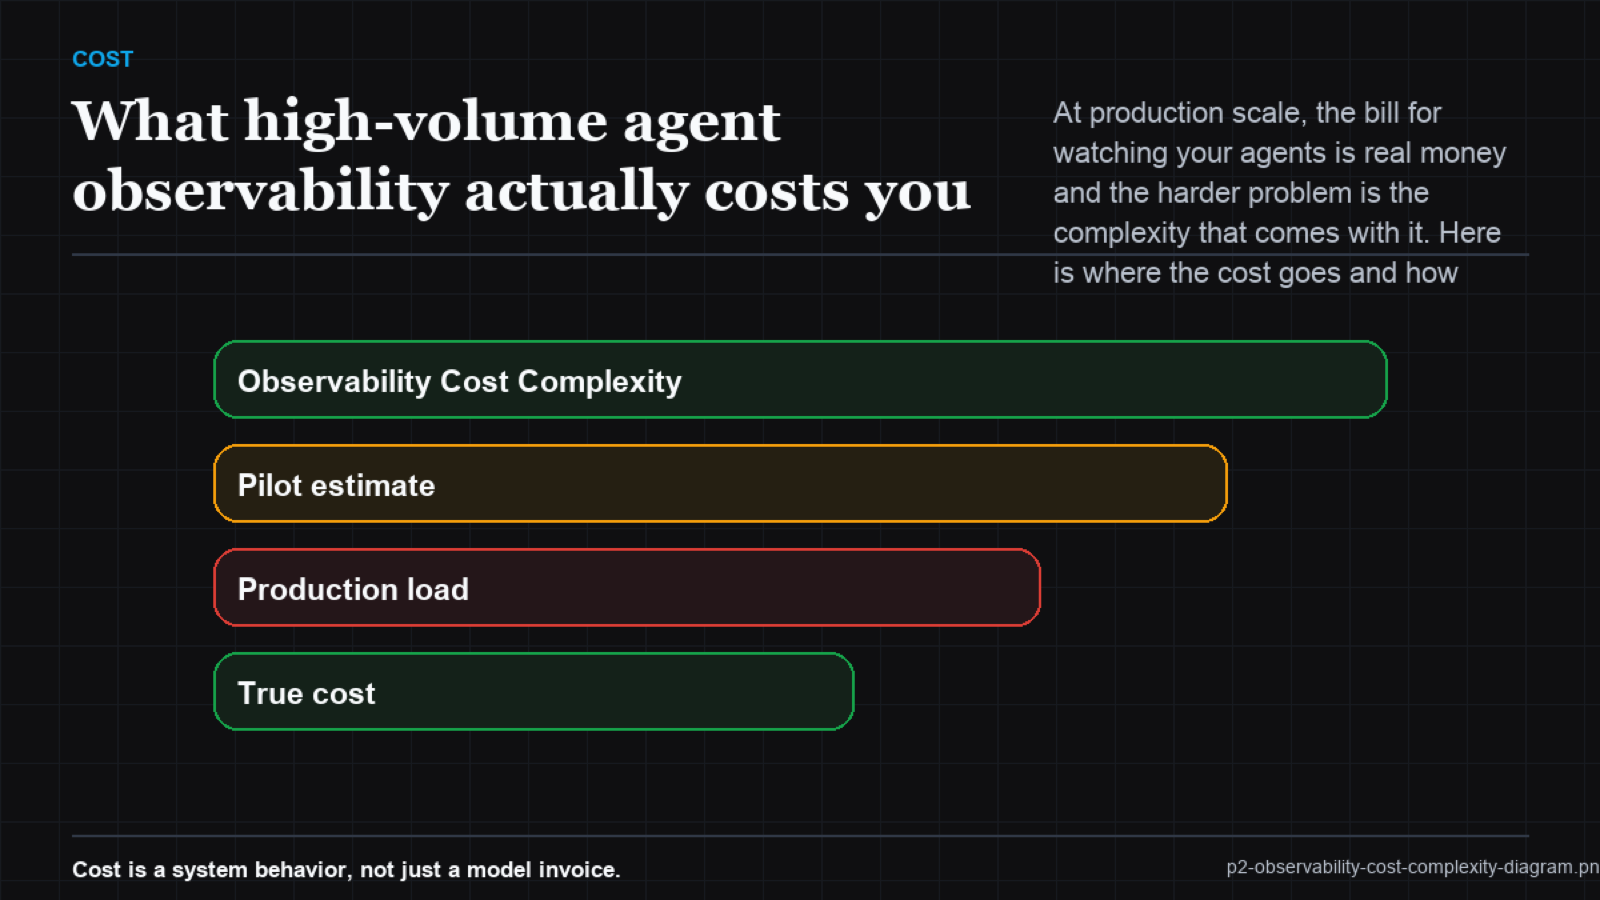
The same property that makes agents worth observing makes them expensive to observe. Every reasoning step, tool call, retrieval, and retry is a span, and the payloads carry large semantic context (prompts, retrieved documents, tool arguments) rather than small numbers. Multiply per-run span counts that are 10x to 50x a normal request by production traffic and the data volume, and therefore the storage, ingestion, and query cost, scales with it. The Grafana survey line captures the trap precisely: costs grow linearly with telemetry volume, but the value doesn't, because the hundredth near-identical successful trace teaches you almost nothing the first one didn't.
So the bill is real, but the survey points at a sharper problem. When teams name their biggest observability obstacle, they name complexity and overhead more often than cost. Running pipelines, tuning sampling, managing cardinality, keeping dashboards meaningful, and doing it across a fast-moving agent stack is operational weight that doesn't show up on the invoice but absolutely shows up in engineering time.
What actually controls the cost without going blind?
The answer is shaping the data, not collecting less of what matters. Put a telemetry pipeline in front of long-term storage so you filter, route, and reduce before you pay to keep anything. Use tail-based sampling to retain every error and slow run in full while sampling routine successes. Drop or summarize the high-volume, low-value payloads and keep the spans that carry decisions. Treat single-vendor cost-reduction percentages and the scarier "surprise bill" anecdotes as reported numbers to pressure-test against your own baseline, not as guarantees. The combination (pipeline plus sampling plus deliberate retention) is what keeps the bill proportional to the insight.
| Lever | What it does | What it costs you |
|---|---|---|
| Telemetry pipeline | Filter, route, reduce before storage | One more component to run |
| Tail-based sampling | Keep all errors, sample successes | Buffering and tuning effort |
| Payload reduction | Drop or summarize large low-value text | Care to not drop the decision data |
| Capture everything (anti-pattern) | Nothing; bill scales with traffic | The surprise invoice |
this is where a Pattern Intelligence Layer earns the spend. Reliability at the pattern level means you spend your observability budget on the decisions and failure patterns that actually recur, not on storing every token of every happy-path run forever. The cost becomes proportional to the insight, the complexity is absorbed into a consistent way of capturing what matters, and the budget survives a jump in traffic or a change of backend.
Frequently asked questions
How much should I expect observability to cost?
Survey data puts it around 17% of compute spend on average, lower at the median, and agent workloads push it up. Treat that as a planning anchor, not a promise; measure your own ratio.
Is cost or complexity the bigger problem?
Survey respondents cite complexity and overhead as the top obstacle more often than cost. The invoice is visible; the operational weight is the part that quietly grows.
Do I have to choose between cost and visibility?
No. A telemetry pipeline plus tail-based sampling lets you keep every failure in full while reducing the routine volume that drives the bill.