


Key facts.
- MIT's NANDA initiative reported that despite an estimated $30 to $40 billion in enterprise GenAI investment, about 95% of organizations saw no measurable P&L return, naming integration and workflow fit as the divide between the 5% that succeeded and the rest. source
- OSWorld measured the best multimodal agents completing about 12% of real-computer tasks against roughly 72% for humans, so the autonomous productivity behind many ROI cases is not yet there. source
- The IMF's 2026 note on agentic payments observes that agent-mediated commerce introduces new operational and oversight costs alongside its efficiency promise, a reminder that the cost side of the ledger grows with autonomy, not just the benefit side. source
Why does the ROI go fuzzy specifically?
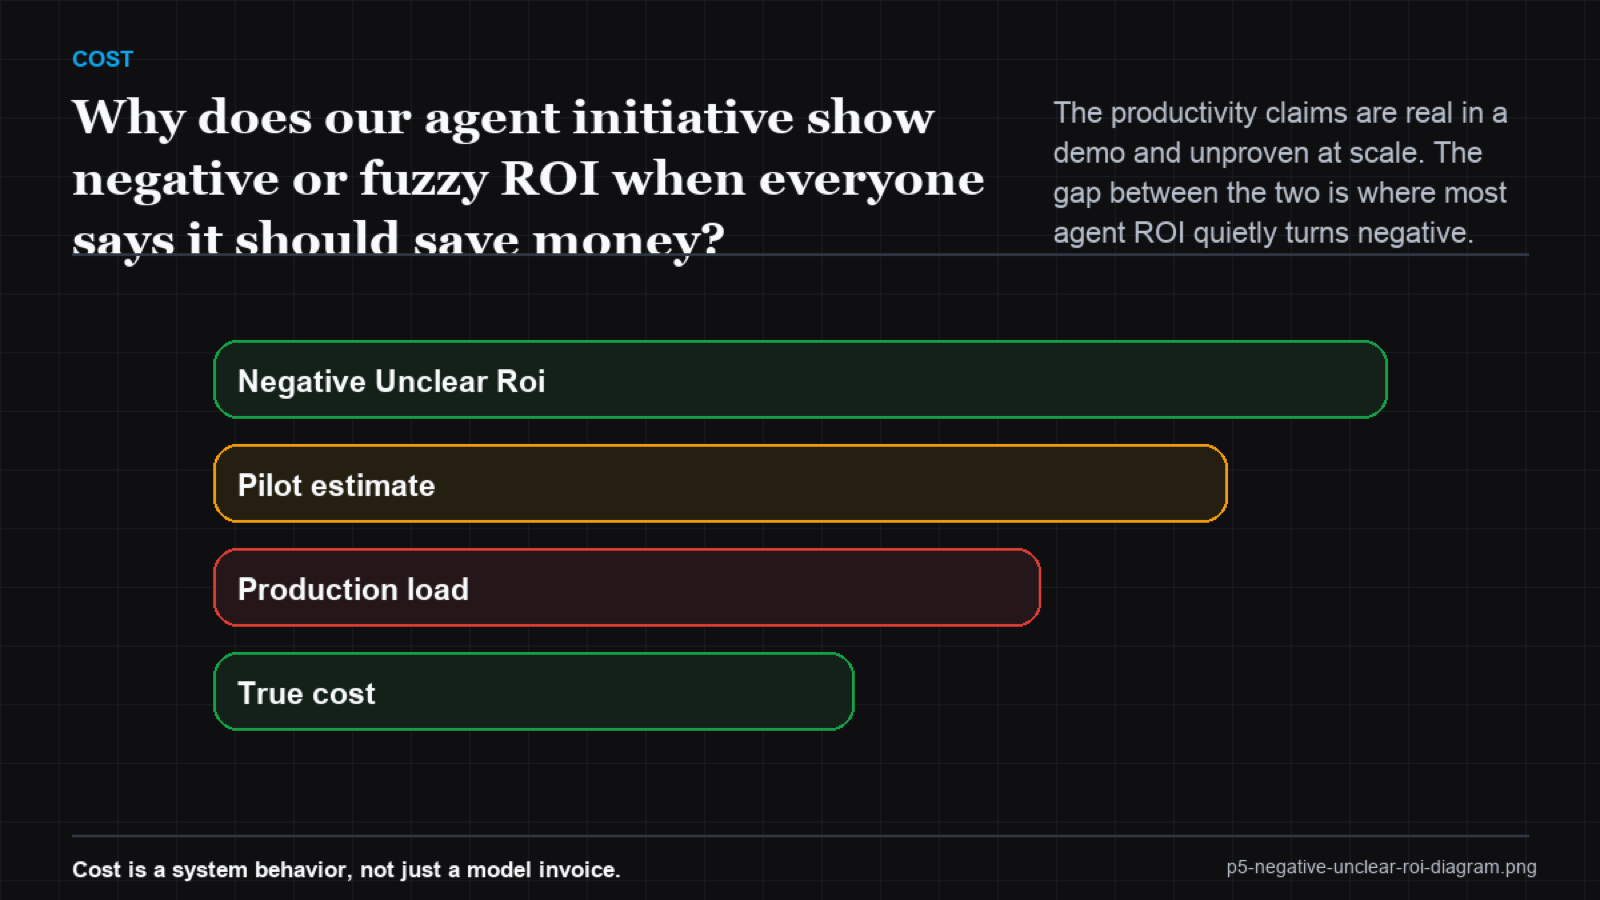
Because the benefit is measured in a setting that excludes the costs that scale. The demo shows time saved on a clean task. The business case extrapolates that saving across all tasks. Then production adds the tasks the agent cannot complete, the oversight that catches its mistakes, and the rework when oversight misses, and those subtract from the saving in ways the demo never showed. When the NANDA study finds 95% of pilots with no measurable P&L impact, that is the arithmetic playing out: the saving was real per successful task and small once the failures, the oversight, and the integration cost were netted against it.
The fuzziness is its own problem. A clearly negative ROI gets cut. An unclear one lingers, consuming budget while leadership waits for the promised value to appear. The teams that avoid both define the outcome metric up front, measure cost per delivered outcome at real scale, and net out the oversight, so the ROI is a number rather than a hope.
How do you make the ROI legible again?
Tie it to an outcome the business already counts, not to a proxy like time saved. Measure the agent's true completion rate on production tasks, because the OSWorld gap shows that rate is often far below the assumption. Cost the oversight and rework that ride on the failures, and subtract them. What remains is the real return, and it may be positive on a narrow, high-success scope and negative on a broad ambitious one. Knowing which is true for your deployment is the difference between scaling a winner and funding a question mark.
| ROI input | Demo-based case | Measured case |
|---|---|---|
| Benefit | Time saved per task, extrapolated | Outcomes the business counts |
| Completion rate | Assumed high | Measured, often far lower |
| Oversight + rework | Excluded | Netted against benefit |
| Verdict | Looks positive | Positive only where scope is right |
The Pattern Intelligence Layer makes the return a measured property rather than a forecast. Completion rate, oversight load, and cost per delivered outcome are tracked at the pattern level, so ROI is something you can show leadership, not something you keep promising. Reliability at the pattern level is what turns a fuzzy initiative into a fundable one.
Frequently asked questions
If returns are negative, will a better model turn them positive?
The saving is assumed from a demo while cost lands in production: MIT NANDA found ~95% of pilots with no P&L return, and a frontier model finishes ~12% of OSWorld tasks versus ~72% for humans. (arXiv:2404.07972)
Everyone reports productivity gains. Why don't we see them?
Gains are usually measured per successful task in a demo. At scale, incomplete tasks, oversight, and rework net against them, which is what the NANDA 95% figure reflects.
Is this a model problem we can upgrade away?
Not mainly. OSWorld shows autonomy is far from complete, but the larger issue is integration and netting real costs, which a model upgrade does not fix.
What single change makes ROI clear?
Tie it to an outcome the business already counts and measure cost per delivered outcome at real scale. Proxies like time saved hide the netting.