


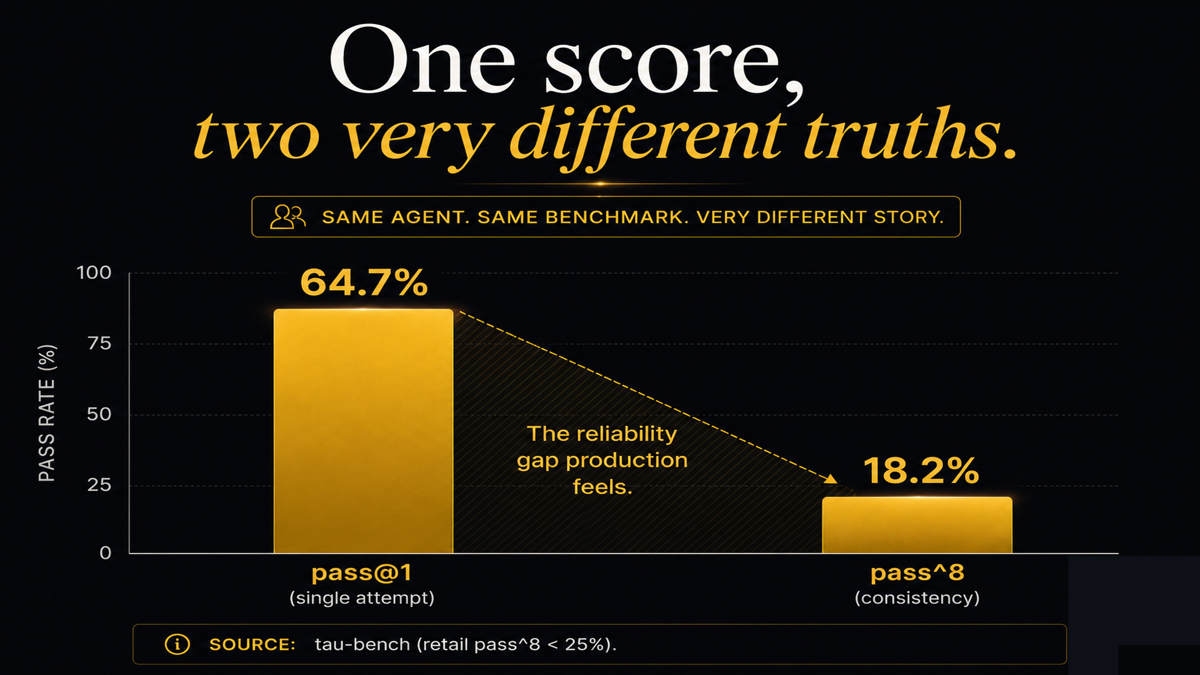
An agent that passes 60% of the time once can pass all eight retries under 25% of the time. tau-bench's pass^k metric shows frontier models are far less consistent than their single-run score, clearing under half of realistic tasks (tau-bench, arXiv:2406.12045, 2024). A leaderboard number is one attempt; production is thousands.

Key facts.
- Consistency is the gap: GPT-4o-class agents clear under 50% of tau-bench tasks and pass^8 falls under 25% in retail, so an agent that often succeeds once is unreliable across repeats, and pass^k is the metric that exposes it (tau-bench, arXiv:2406.12045, 2024).
- On realistic assistant tasks the gap is stark: humans scored 92% on GAIA while the best AI assistant scored 15% at release, a gap a tidy function-calling score hides (GAIA, arXiv:2311.12983, 2023).
- Agent evaluations lean on curated or synthetic data that misses emergent behavior and operational degradation after deployment, so a benchmark pass is not a production guarantee (Evaluation and Benchmarking of LLM Agents: A Survey, arXiv:2507.21504, 2025).
What does a tool-use benchmark actually measure?
A clean slice of the problem. Most function-calling evals present curated tools with exact schemas, a cooperative or simulated user, and a single attempt, then score whether the call was well formed. That is useful, and it is not production. Production tools drift, return partial or error responses, hit rate limits, and live inside policy rules the agent must not break. The task is long and stateful, so one bad step corrupts everything after it, and the only score that matters is whether the final system state is right. tau-bench was built to measure exactly that, the end state after a realistic interaction, and it shows agents that look strong on paper clearing under half of its tasks (tau-bench). The headline number answered an easier question.
Why does the score not predict reliability?
Because reliability is consistency, and a single-attempt accuracy hides it. An agent that succeeds 60% of the time on the first try can be far less consistent across eight tries, which is why tau-bench reports pass^k and finds retail consistency under 25% (tau-bench). Production runs the same task thousands of times under varying conditions, so the tail of failures, not the average success, defines the experience. And on realistic assistant tasks the gap is enormous: humans clear 92% of GAIA while the best assistant managed 15% at release, the kind of real-world shortfall a clean function-calling score never shows (GAIA). A model card reports none of that.
# Accuracy hides consistency. Measure pass^k.
runs = [run_task() for _ in range(8)] # same task, 8 trials
pass_at_1 = sum(r.ok for r in runs) / 8 # looks fine: e.g. 0.62
pass_pow_8 = all(r.ok for r in runs) # reliability: often False
# Ship on pass^k, not on a one-shot leaderboard number.
How do you close the gap on purpose?
Test for the conditions you will actually run in. Evaluate on realistic multi-turn, policy-constrained benchmarks and on your own tasks, with schema-variance and error injection so partial and failed responses are part of the test. Measure consistency with pass^k and track policy-violation rates, not just single-call accuracy. Add the layers the benchmark assumed away: state validation between steps, an explicit error taxonomy, and an independent verification check before the agent declares success. Instrument the full tool input, output, and reasoning so a failure is diagnosable. The model card tells you the ceiling under ideal conditions. The engineering around it is what turns that ceiling into a floor you can promise a customer.
Benchmark world versus production world
| Dimension | Model-card benchmark | Production |
|---|---|---|
| Tools | Clean, documented, stable | Drifting, partial, rate-limited |
| User | Cooperative or simulated | Real variance, edge cases |
| Horizon | Short, often one step | Long, stateful, compounding |
| Score | Single-attempt accuracy | Consistency (pass^k), final state |
| Policy | Rarely tested | Must hold every time |
The pattern is that an advertised tool-use score answers an easier question than production asks, clean tools and one attempt versus drift, state, policy, and thousands of repeats. Test for consistency, inject the messiness, and add verification, and you convert a leaderboard ceiling into a reliability floor. Building that verification and consistency layer around the model, so the capability holds under real conditions, is exactly what VibeModel builds as the Pattern Intelligence Layer.
Frequently asked questions
Does a higher tool-use benchmark mean my agent is production-ready?
Model cards score one-shot calls on clean tools; an upgrade moves that number, not the long stateful task. (arXiv:2406.12045)
Are benchmarks useless then?
No. They bound capability under ideal conditions and let you compare models. They just do not measure consistency, error handling, or policy adherence, so do not read a leaderboard number as a production guarantee.
What single metric should I add?
pass^k. Run each task several times and require it to pass every time. That one change surfaces the consistency gap a single-attempt score hides.
Why does a bigger model not just fix it?
A bigger model raises the average but still runs against drift, partial responses, and policy under load. Without verification and consistency testing, you are shipping the same unmeasured tail.